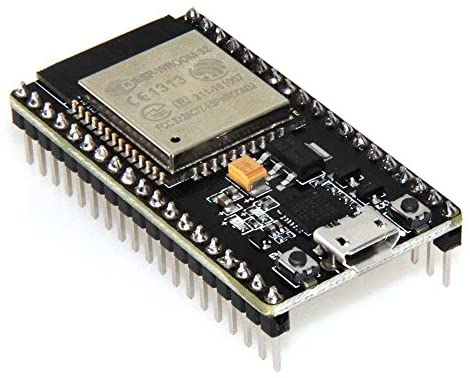
ESP-32 WROOM Board
For my second project after my Kart, I took inspiration from a plant that I had just bought. The plant was a Rabbit's Foot Fern and I bought it because I thought it looked cool. It got me thinking about how a plant only needs a few resources to live and grow. Sunlight and water are the two main ingredients to successfully grow a plant, but different plants like different environments. There are also other considerations such as temperature and humidity where the optimal value changes from plant to plant. Since I like working with sensors, I thought that combining several of them into one package would be a great project. In order to add a bit of complexity, I also decided to create a server to store all of the data points and to create graphs. I felt that this device was different enough from the Kart to add variety to my project portfolio
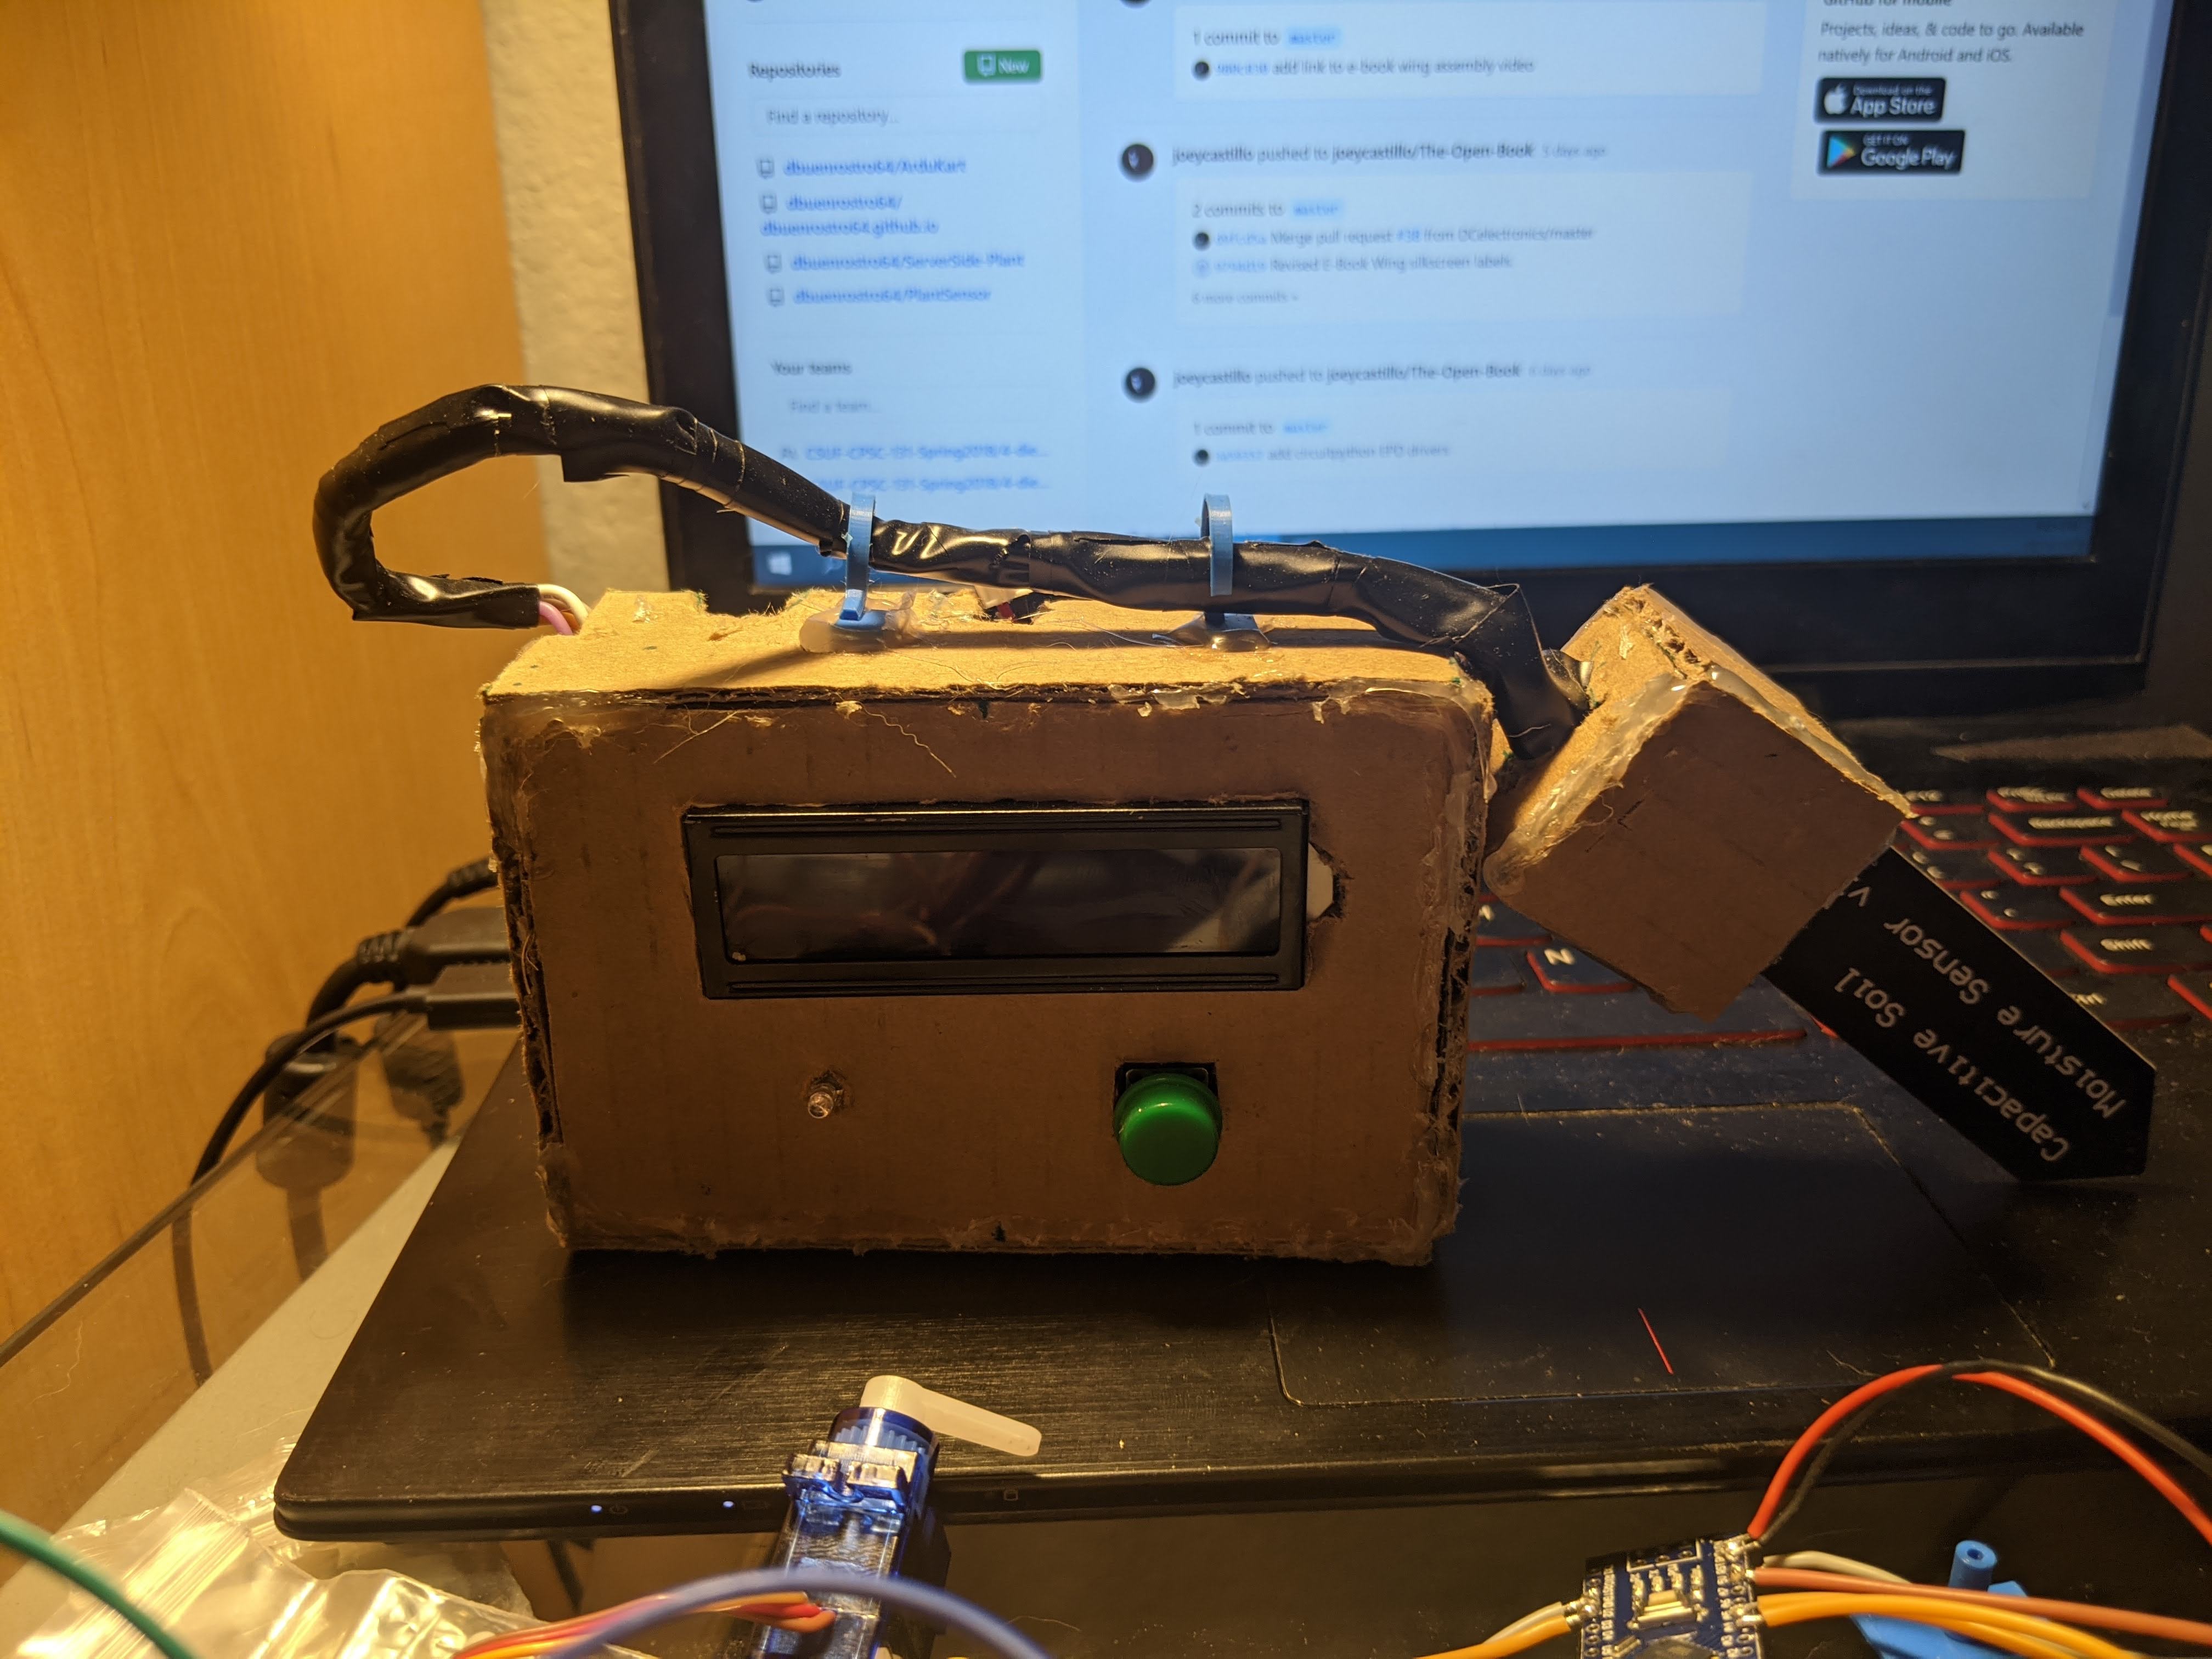
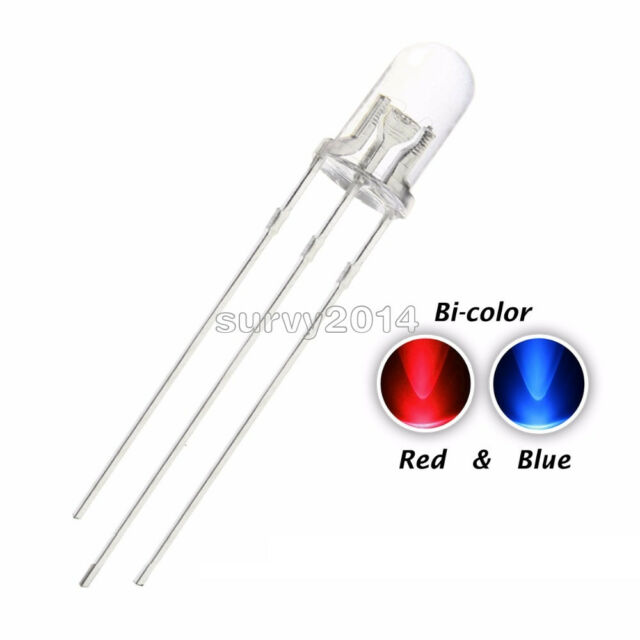
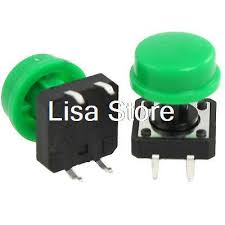
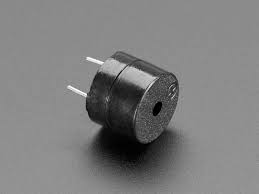
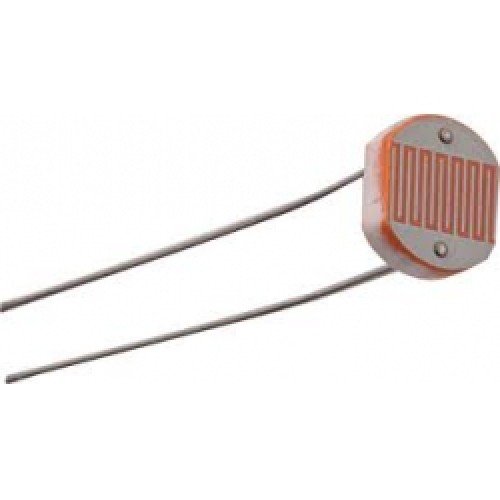
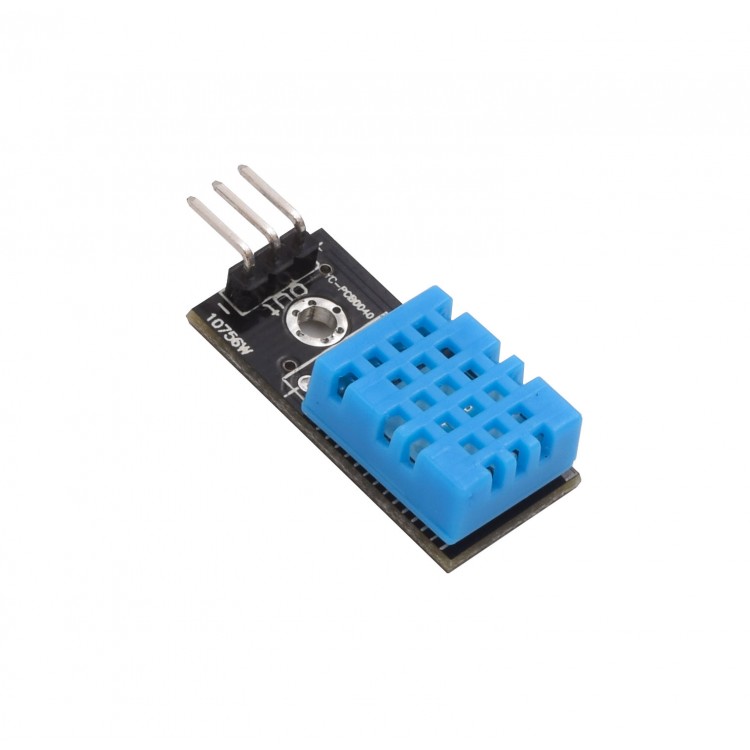
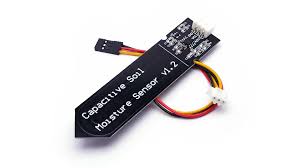
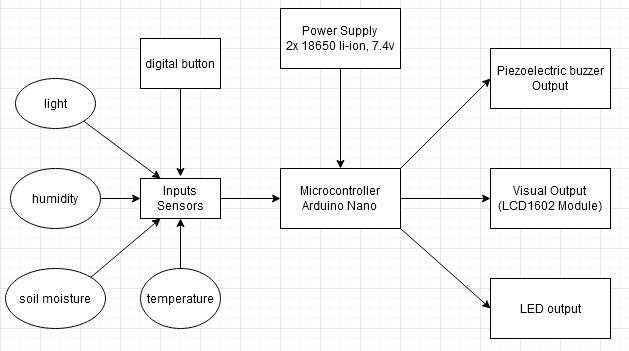
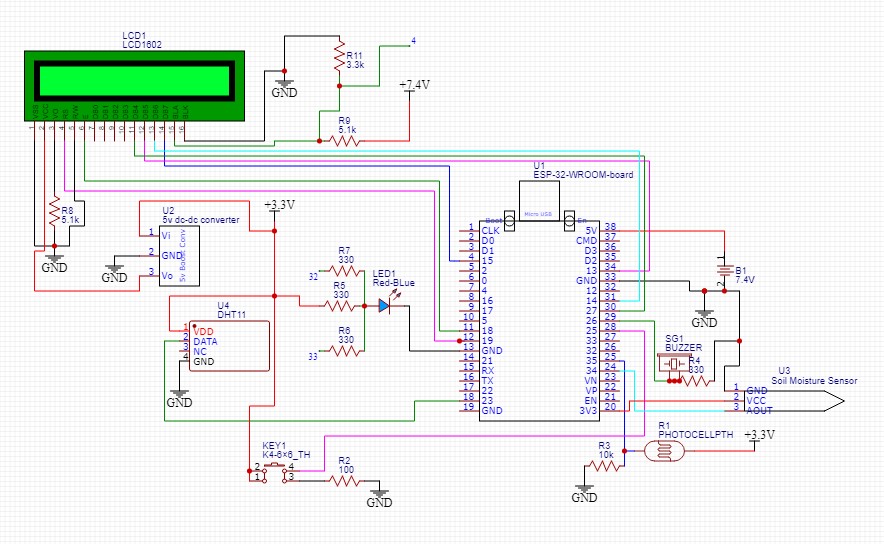
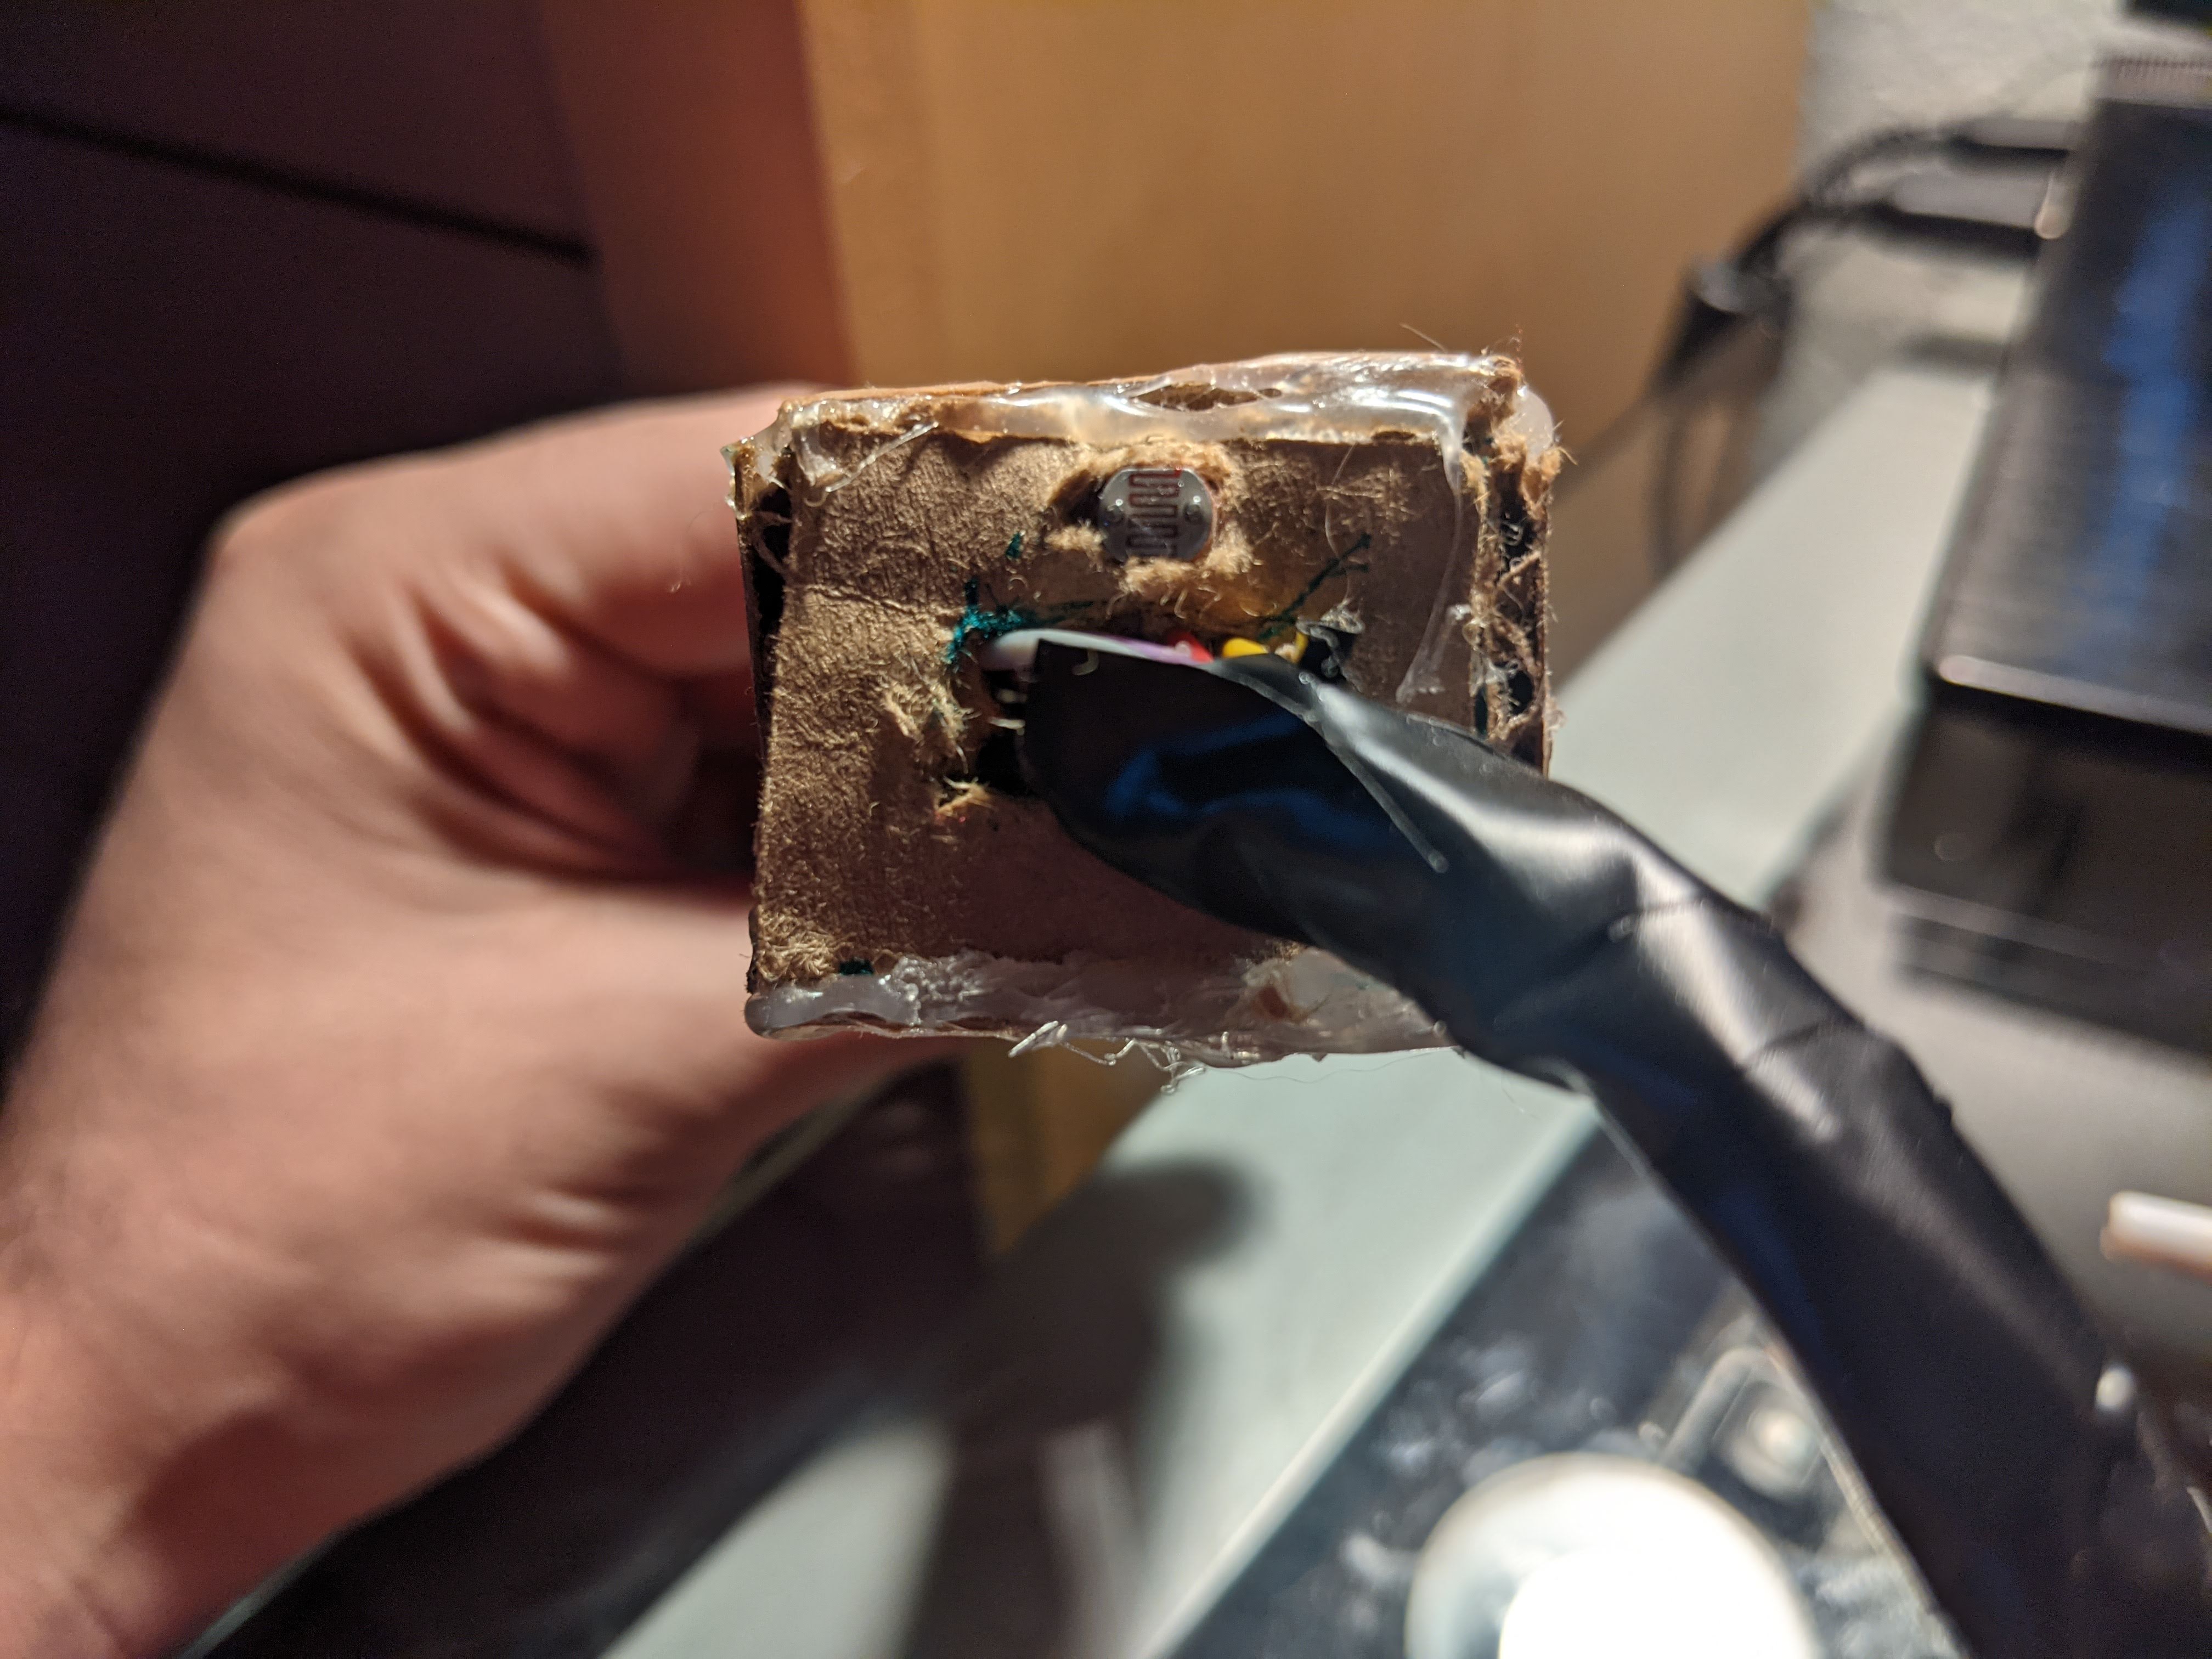
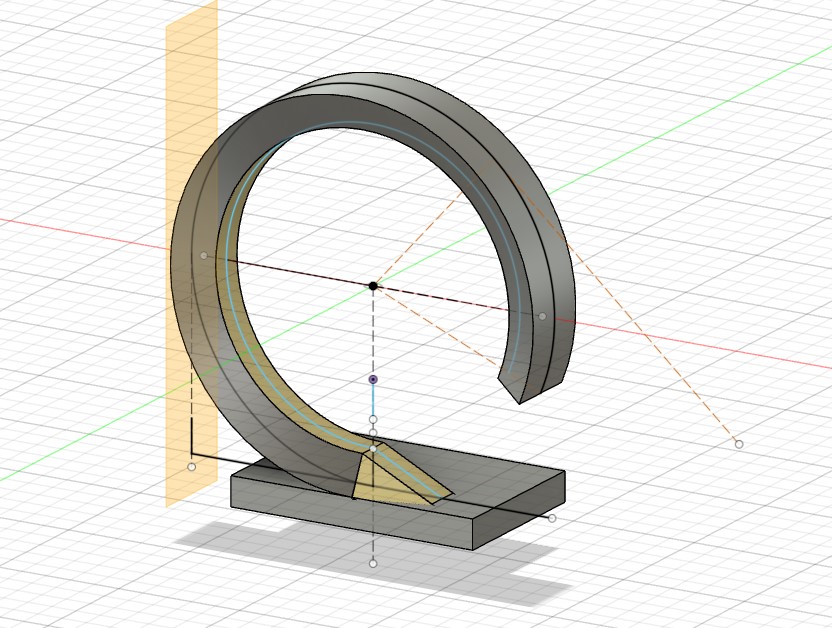
The two main parts of this project are the physical device and the server that it connects to. The device centers around the ESP32 microcontroller which is WIFI capable. The WIFI is used to connect to the server which is on my WIFI network. The local server is based on a Raspberry Pi which I can simply leave plugged in so that I can collect data. On the device, the sensors that it uses to collect data on a plant are for water moisture, light, temperature, and humidity. All of these sensors are located on the arm of the device in order to dig it into the plant's soil. The LCD display will display the data coming in by pressing the button to cycle through the sensors. If the button is held down, the device will go into plant testing mode where it will check the current sensor data and determine if the plant is healthy. If the LED flashes blue then the plant is healthy. If the LED flashes red, then the plant needs to be looked after. At a certain interval of time, the current sensor data will be uploaded to the server. This interval can be adjusted to any value. By going on the local server, the MySQL database can be acessed as well as the data graphs.
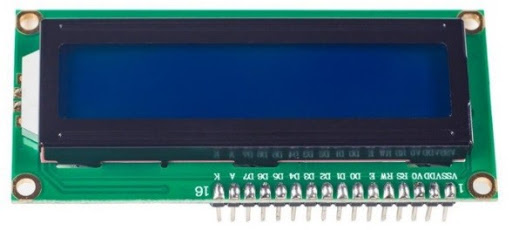
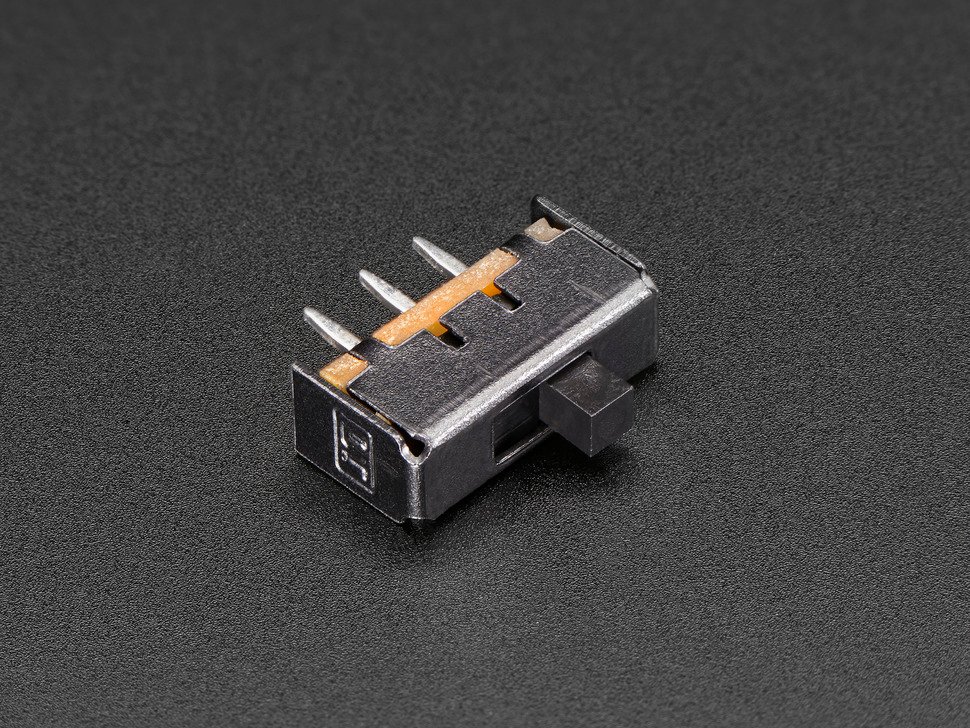

Shows different sensor values, then activates plant testing mode.
Data from sensors is inserted into database using PHP script
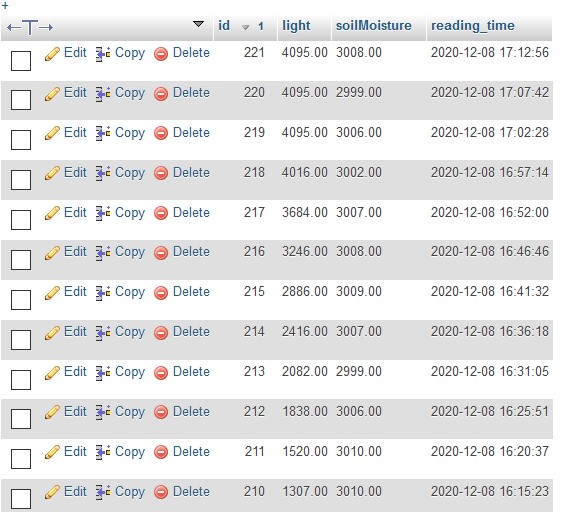
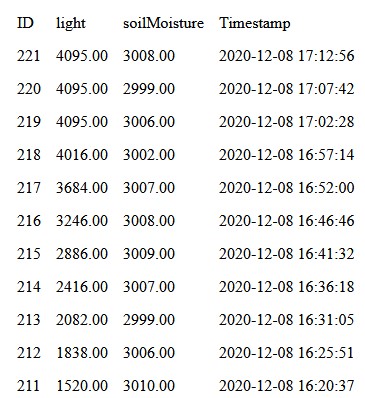
Data is fetched from database and organized into a table
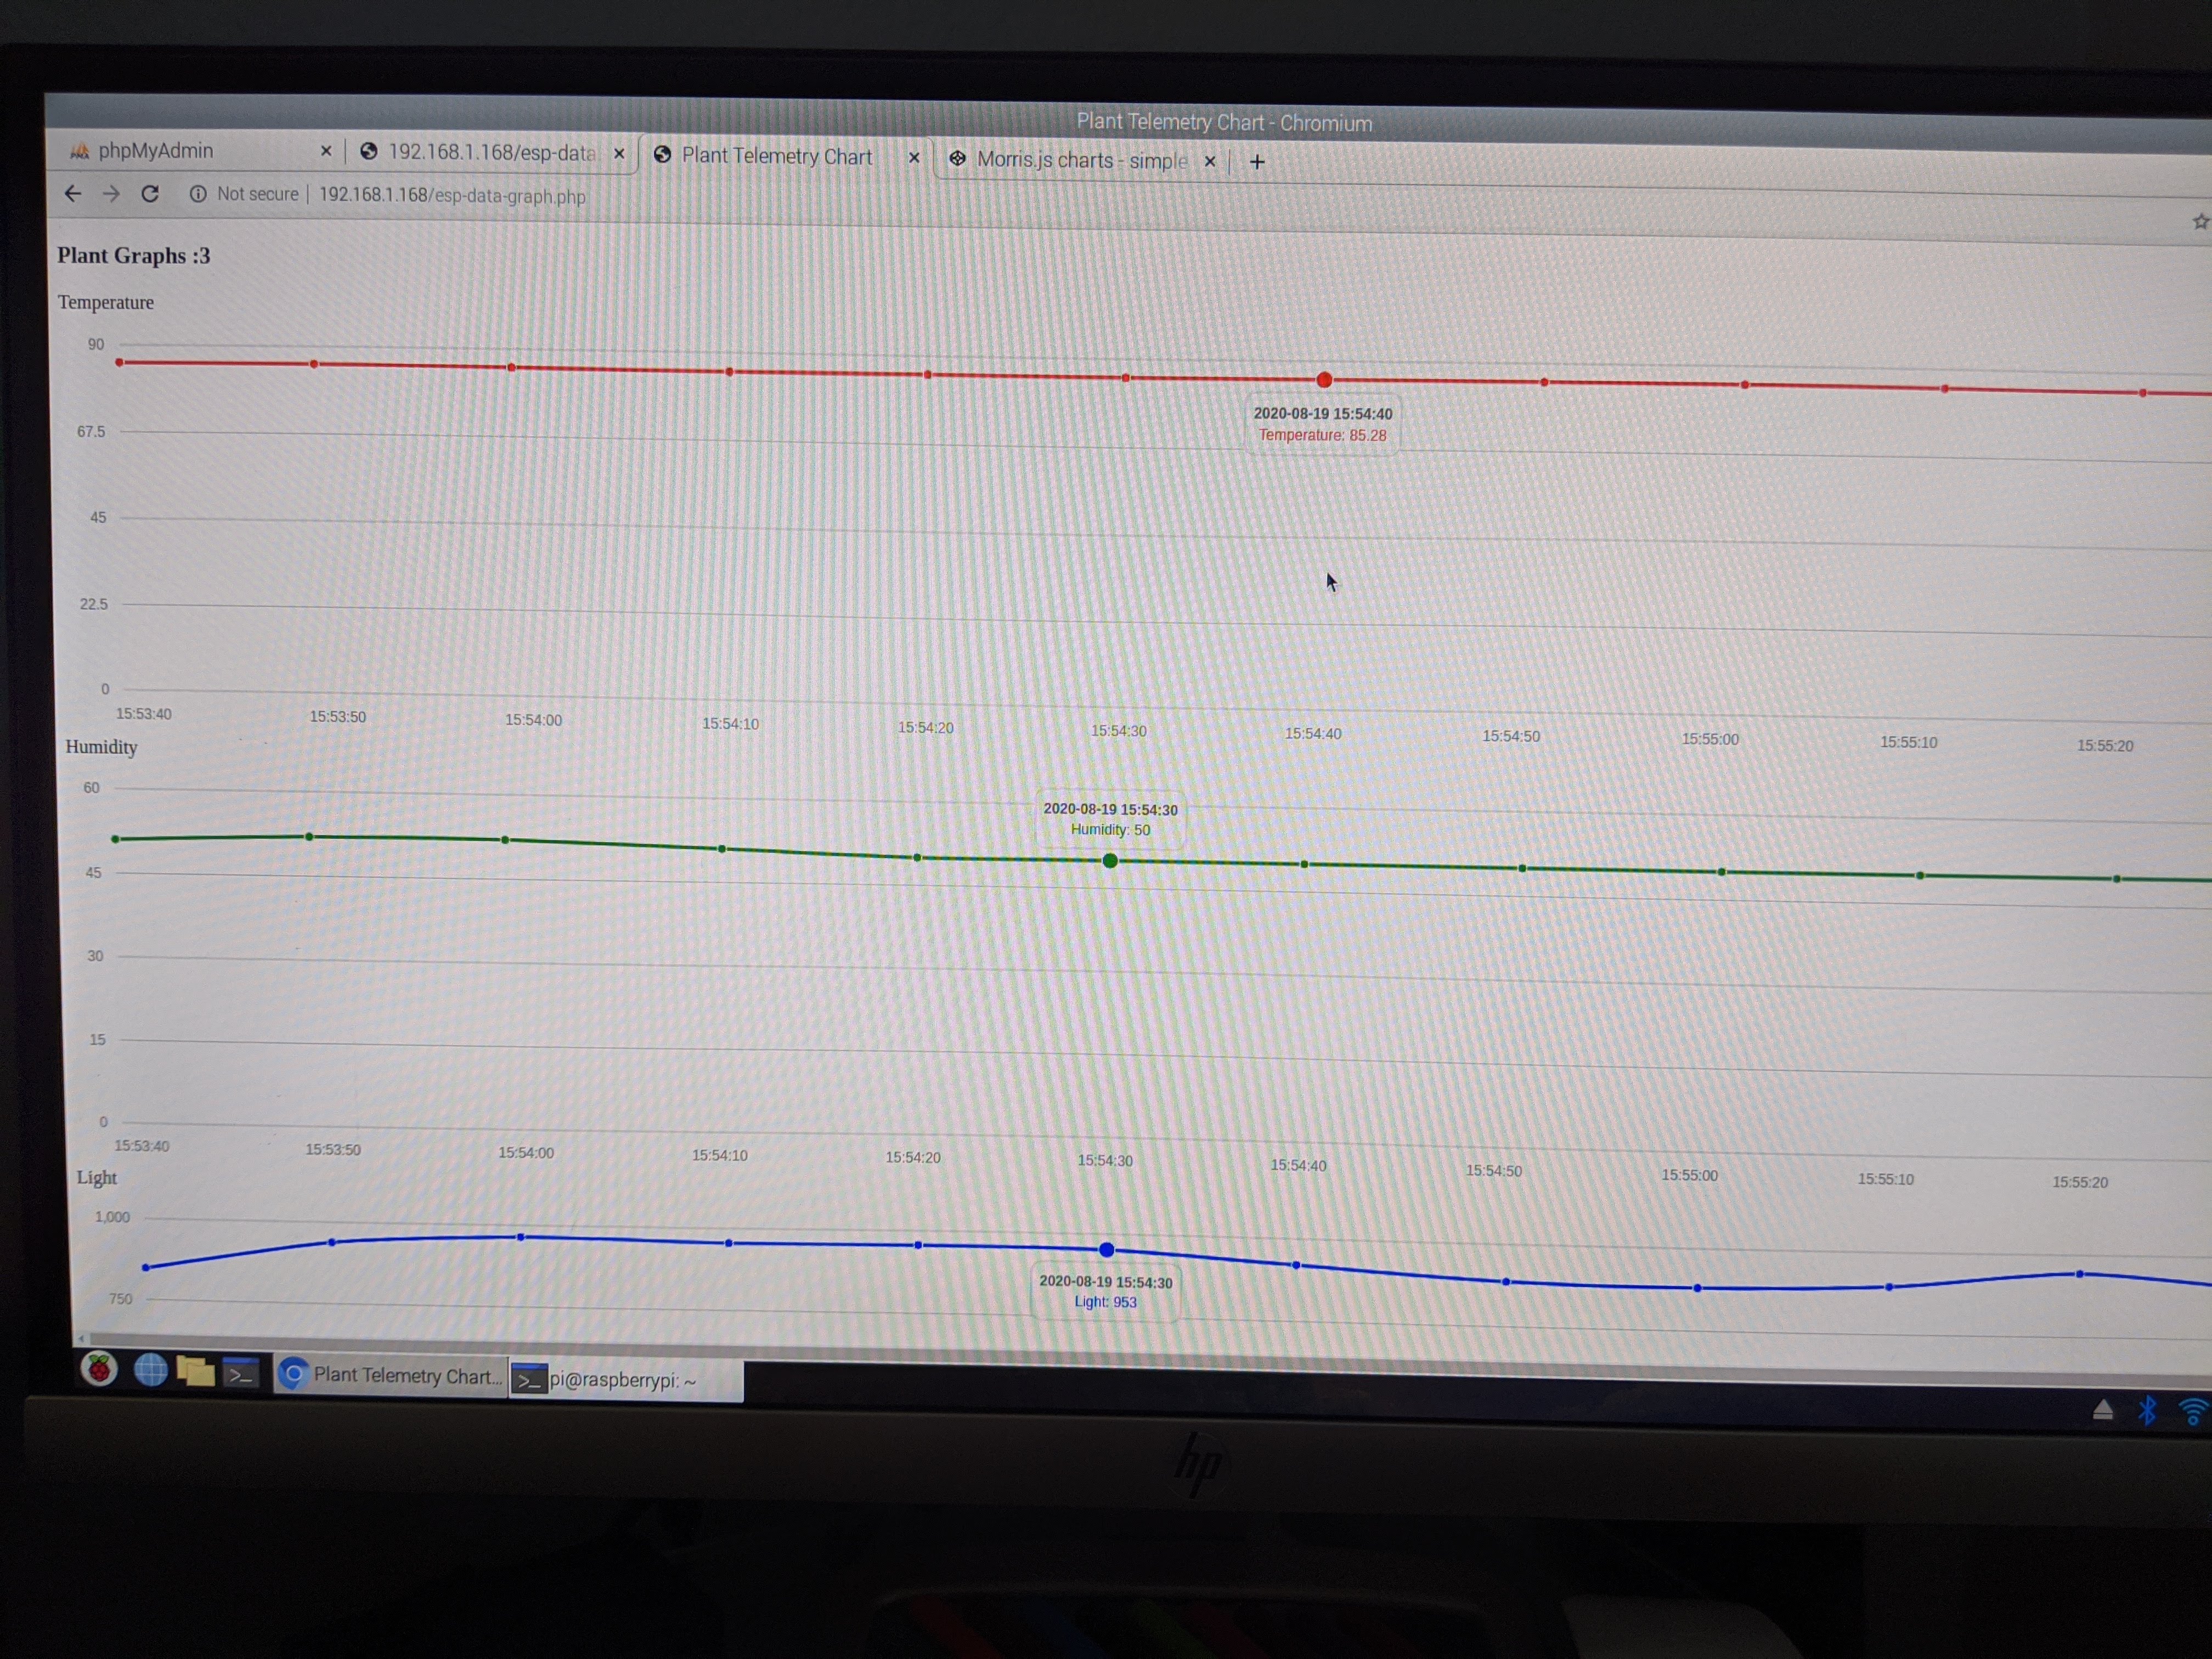
Data is fetched from database and organized into graph
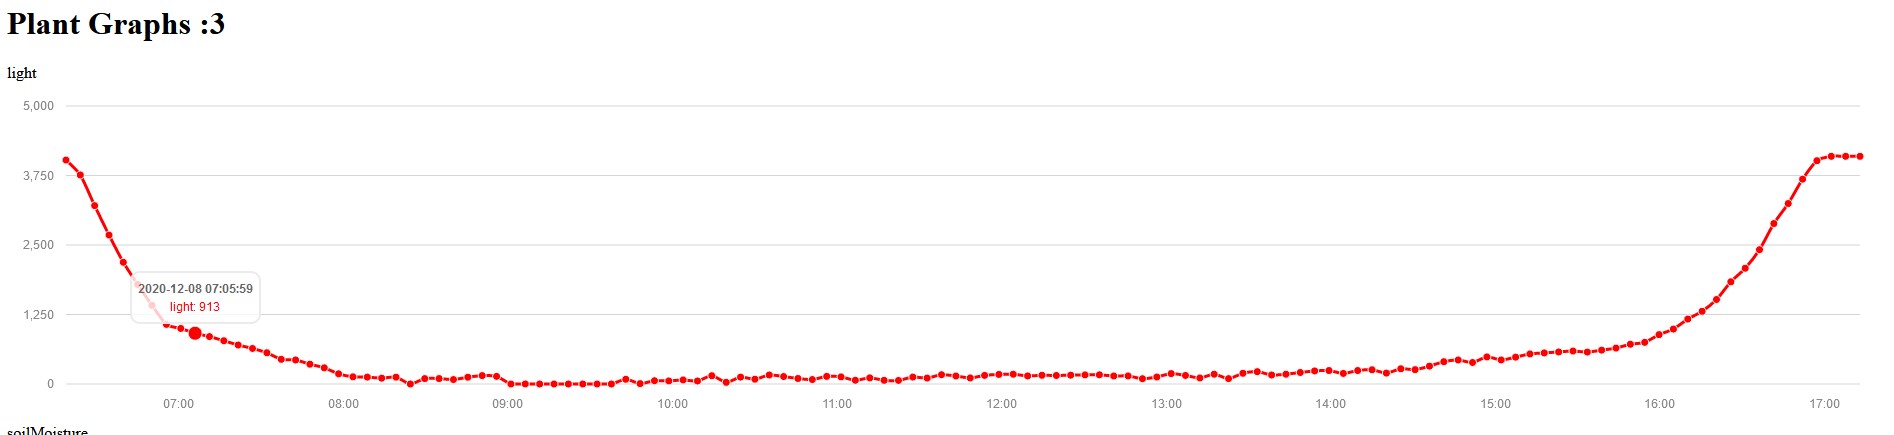
This graph displays the levels of light outside throughout the day (6AM-5PM).
0 represents the max light level.
4095 represents the lowest light level.
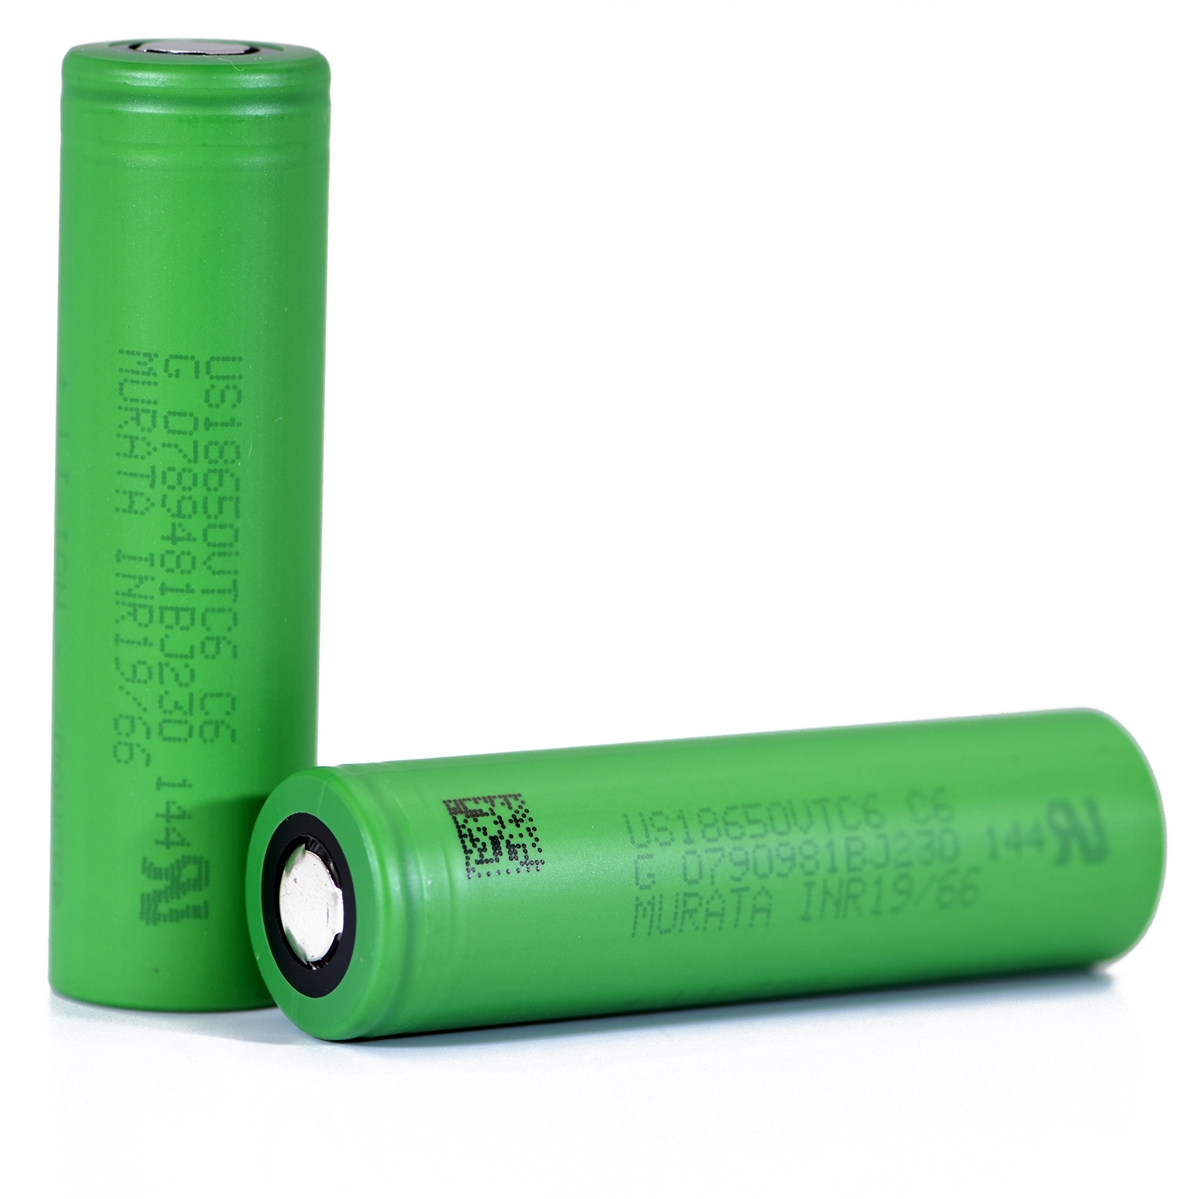
This test was conducted by taking a measurement and sending the data to the
server every 5 minutes. In between measurement the ESP32 would go into sleep mode
which consumes a very small amount of battery life. The battery lasted the entire
test and dropped from about 8.2v to 8.0v
Data is fetched from database and organized into graph
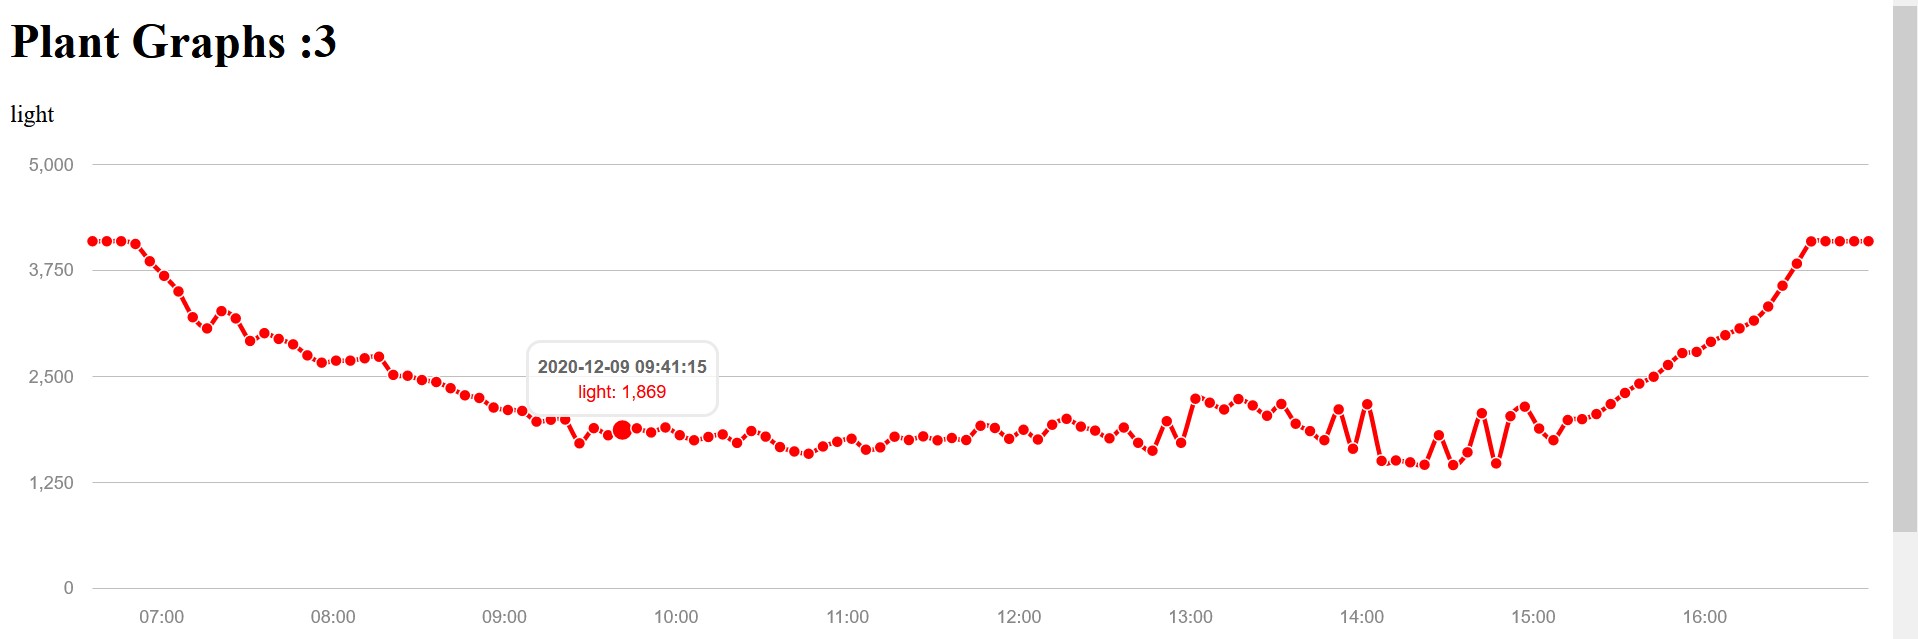
This graph displays the levels of light next to a window throughout the day (6AM-5PM).
0 represents the max light level.
4095 represents the lowest light level.
This test was conducted by taking a measurement and sending the data to the
server every 5 minutes. The data shows that the room only got half as bright
compared to the measurements done outside. The max brightness level reached
is 1475. The max brightness level detected outside was 0.
Data is fetched from database and organized into graph
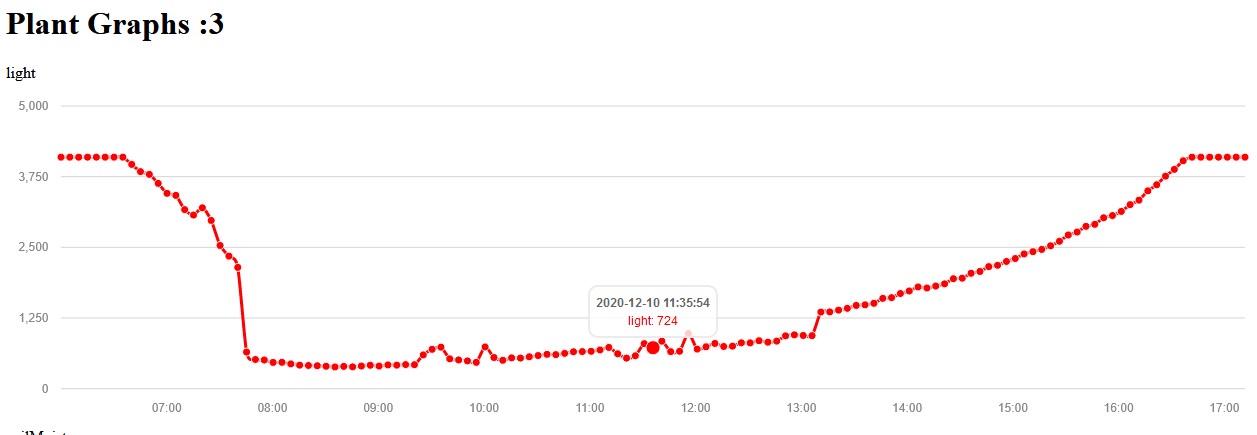
This graph displays the levels of light next to a window throughout the day (6AM-5PM).
0 represents the max light level.
4095 represents the lowest light level.
This test was conducted by taking a measurement and sending the data to the
server every 5 minutes. This time I chose a different window in the house to perform the same test.
The light levels at this window were higher than the last one, but it did not reach the same levels
as outside. The graph shows that light levels were closer to the max level, but did not reach it.